Available on: Web app
Drawboard Projects lets you generate a formatted report from a task list, e.g. your Issues or Tasks lists. Reports are useful when you need to share progress with a client, hand over a completed scope, or keep a record for the project file. This is separate from the CSV export, which gives you the raw data to work with in a spreadsheet.
If you are new to task lists, Power up your design review with Task Lists and Issues covers how lists and issues work.
What a report covers
A report covers the list you are currently viewing. Open the report dialog from your Issues list and you get an Issues report. Open it from your Tasks list and you get a Tasks report. Each report covers a single list.
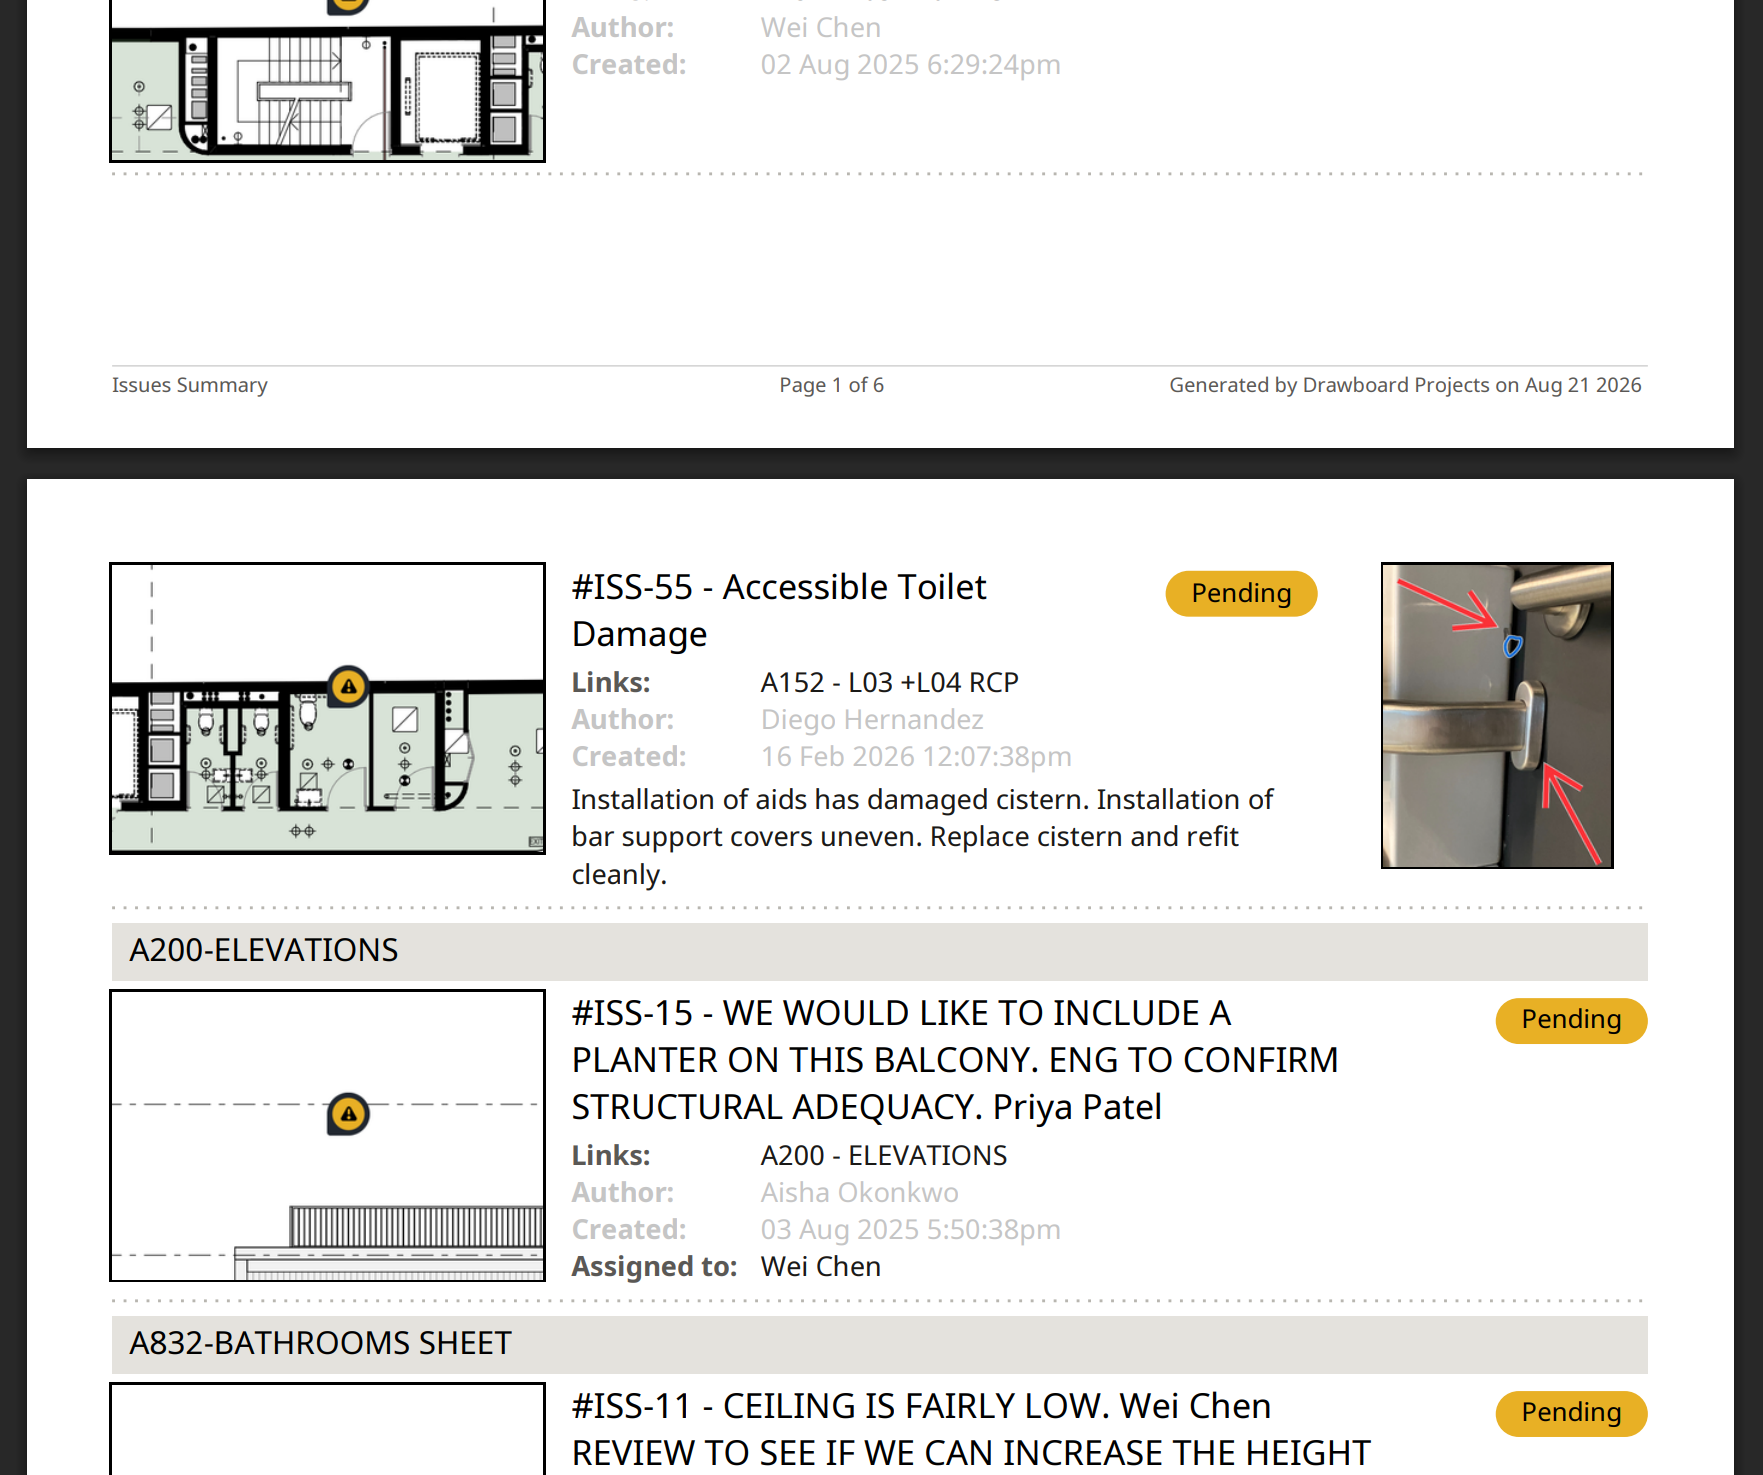 The contents of a Summary report
Generate a report
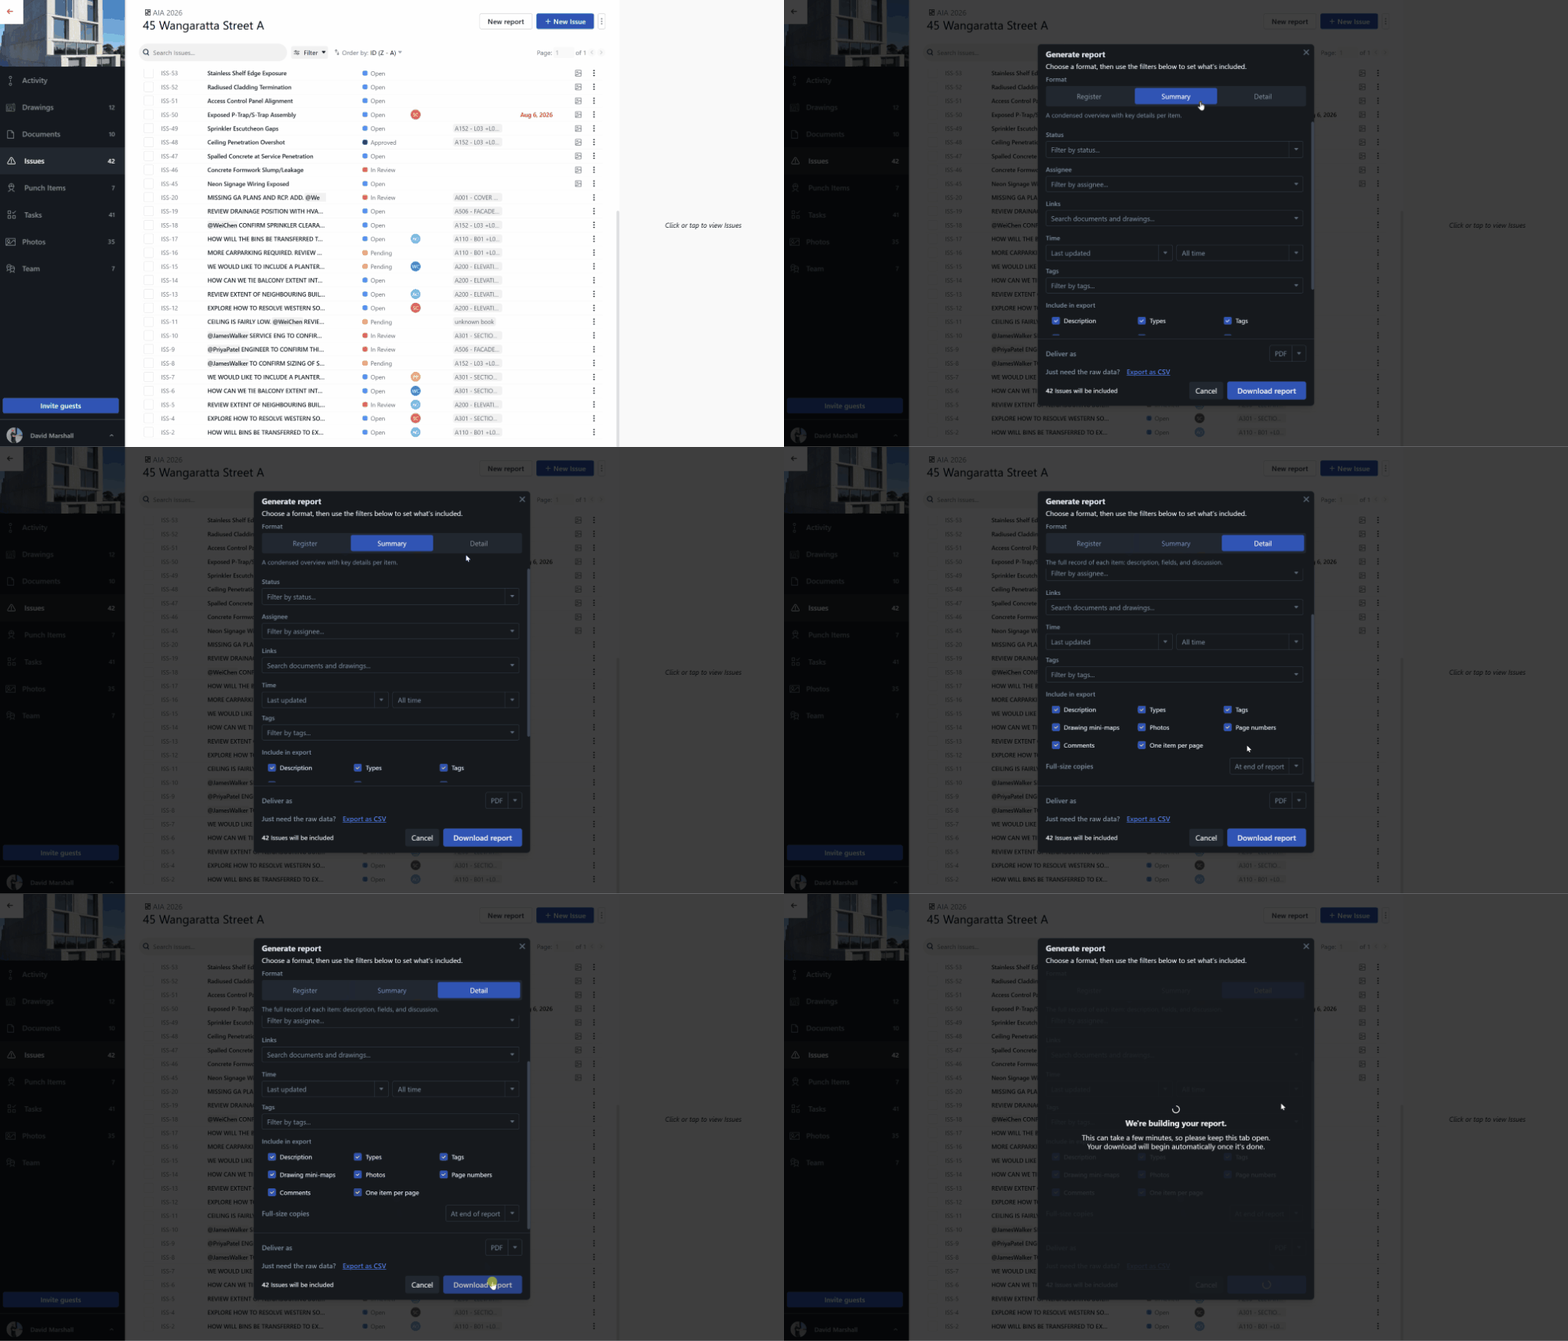
- Open the list you want to report on.
- Select New report, next to + New Issue.
- In the Generate report dialog, choose a format, adjust the options to suit, then generate. Your report is ready to download or share.
Choose a format
Pick the format that matches how the report will be used.
| Format |
What it looks like |
Best for |
| Register |
One row per item, spreadsheet style |
Tracking, reconciliation, and sign-off |
| Summary |
A compact visual overview |
Status updates and client check-ins |
| Detail |
The full record of each item, including its description, fields, and discussion |
Handovers and formal records |
Under Deliver as, choose whether to produce the report as a PDF or an HTML web page. PDF is selected by default and is the right choice for a fixed, printable document. HTML is useful when you want an interactive page you can open in a browser.
Control what is included
A number of filtering options control which items appear in the report. The most common is status. By default, a report includes all items. You can adjust this to include completed items, pending items, or specific statuses, and you can apply the list's other filters as well to narrow the report further.
As you adjust the filters, the count in the bottom left of the dialog updates to show how many records will be included. Use it to confirm the report contains what you expect before you generate.
Include full-size plans
You can include full-size copies of the drawings in the report, so the plans travel with the issues rather than being referenced separately. Choose where they appear:
-
At the front, which works well when the drawings set the context before the issue detail.
-
At the end, which works well when the report leads with the issues and keeps the plans as an appendix.
Mini-maps
For any issue that has been pinned to a location on a drawing, the report includes a mini-map: a small view of the drawing with the pin, showing where the issue sits on the plan. Mini-maps give the reader spatial context without opening the full drawing. Issues that have not been pinned to a drawing location do not have a mini-map.
Group by drawing
Items can be grouped by the drawing they are linked to, so everything associated with a given drawing appears together under that heading and the report reads the way your drawing set does. Turn grouping off if you would rather see a single flat list.
Links in the PDF
The PDF report is cross-linked so readers can move between related content:
- Each issue links to its full-size drawing, when plans are included in the report.
- Each issue and photo links to its live counterpart in Drawboard Projects, so a reader can open the current version in the web app with one click.
Export raw data instead
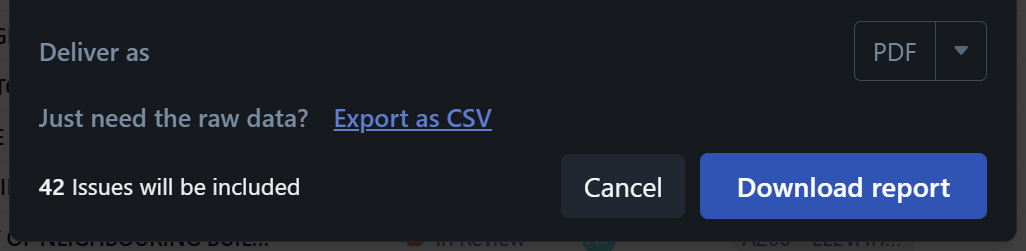
If you need the underlying data rather than a formatted report, use Export as CSV at the bottom of the dialogue. This produces a spreadsheet-ready file of the current list, which you can open in Excel or import elsewhere.
A note on multi-page documents
Issues and tasks can be linked to and pinned on single-sheet drawings, or on pages within multi-page documents. Reports include the issues and tasks themselves regardless of what they are linked to. However, only single-sheet drawings are included as full-size plans and mini-maps. Items pinned to a page in a multi-page document still appear in the report, but that document page and its mini-map are not currently included.
Related